6. Interpreting CSPM Output
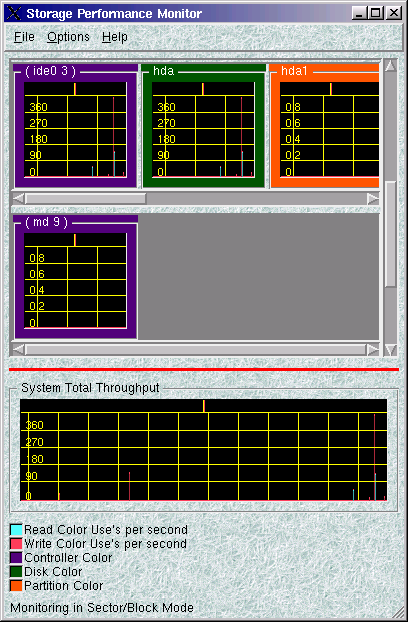
When you start up CSPM, a collection of histograms appears. Each histogram shows data for either a controller, disk, partition, or system throughput. The key at the bottom of the histogram tables tells which color of histogram box corresponds to which type of device. The following sample CSPM session shows controller (purple), disk (green), partition (orange), and system data.
Use the horizontal and vertical scroll bars to view controller, disk, and partition histograms that do not fit on the initial screen.
By default, the number of "range bars" along the y-coordinate of each histogram is five. When there is no activity for a particular device, CSPM provides default values of 0, 0.2, 0.4, 0.6, and 0.8. Once activity begins on the device, CSPM sets the five values in equal increments from 0 to the peak data value collected in each collection interval. Sometimes the grid lines fall directly on the range bar numbers, making the numbers hard to read. You can either adjust the color of the grid lines, adjust the collection interval, or try to ignore the grid lines.
To see information about a partition (such as filesystem name, space used, and space available), right-click on the partition's histogram and then left-click on . A Partition Status window opens that displays information about the selected partition.

(This feature will be implemented for controllers and disks in a later release of CSPM.)